
This Small Cap Is Quietly Powering Data Centers, Nuclear & Semiconductors — And the Market Still Thinks It Just Makes Pipes
Record revenue. Flat profit for nine quarters. A 7x capacity build the market ignored — and multiple sectors now quietly lining up at the door.

Let me put three things in front of you that the market is currently treating as unrelated and show you why they’re actually the same story.
Thing one: somewhere in India, a data centre operator running AI servers that generate so much heat they’d melt themselves without cooling — went searching for a company to build its liquid cooling infrastructure. It picked a small-cap stainless steel pipe manufacturer most analysts barely cover. It handed that company a ₹185 crore letter of intent before the factory to fulfil it had even been built.
Thing two: India’s first semiconductor fabrication plants are coming. Every fab needs ultra-pure piping where a single microscopic particle in the fluid network can ruin an entire wafer batch worth crores. The specifications map directly to high-precision stainless steel tubes. The companies that hold the right quality approvals now will be the ones getting the calls when construction begins.
Thing three: a nuclear power expansion is underway. The cooling systems inside a reactor need tubes with essentially zero tolerance for error — the most demanding application in all of industrial manufacturing. This is where the highest margins in the entire pipe industry live.
Three sectors. Three different technical demands. Three different timelines. And they all converge on the same answer: you need precision stainless steel piping, made by someone with the certifications, the track record, and the manufacturing depth to be trusted.
Now here’s the part that should stop you cold.
The company sitting at that intersection — the one the data centre already chose, the one building the capability that semiconductors and nuclear will eventually need — has had its profit stuck flat for nine straight quarters. Record revenue. Clean books. A 7x capacity expansion just completed. And a bottom line that hasn’t moved.
The market looked at that frozen profit and filed it under “boring pipe company, nothing to see.” But what if the market is reading the wrong number? What if that flat profit isn’t the story — but the setup for it?
That’s the puzzle this whole piece is built to solve. And I promise you’ll be able to answer it yourself by the end — even if you’ve never read a balance sheet and the words “seamless stainless steel pipe” make your eyes glaze over. Every bit of jargon gets explained in plain English the first time it appears.
Two numbers to hold from this moment on. The flat profit — nine quarters of it. And a second one you’ll meet later in the financials: a cash-conversion figure that looks, at first glance, like a red flag. Keep both close. By the end, I think you’ll see the crowd may be reading both of them exactly backwards.
The company is Venus Pipes & Tubes. Let’s take it apart, layer by layer, from the raw steel to the boardroom.
First, The Dumb Question Nobody Wants to Ask: What's The Difference Between a Pipe and a Tube?
Before we get to data centres and nuclear reactors, we need to get our hands dirty with the basics. Because if you don’t understand what this company actually makes, everything else is just noise.
Most people assume “pipes” and “tubes” are the same thing said two different ways. They’re not. And the difference is the entire investment story in miniature.
A pipe is about transport. Think of the large-diameter arteries that carry water, oil, gas, steam, and chemicals from one place to another. Pipes are made in bulk. They’re bigger, they’re standardised, and — here’s the key — they’re relatively easy to make. Low capital, low margin, high volume. This is the “volume engine.”
A tube is about precision. Tubes go into heat exchangers, condensers, instrumentation, and — yes — nuclear reactors. Here, a tube can be as small as 3mm in diameter, and the tolerance for error is basically zero. These are harder to make, they need more capital, more engineering, more expertise. And so they carry far better margins. This is the “precision engine.”
So when you hear “Venus makes pipes and tubes,” what you should actually hear is: Venus operates in both the high-volume commodity game AND the high-margin precision game. One pays the bills. The other builds the wealth.
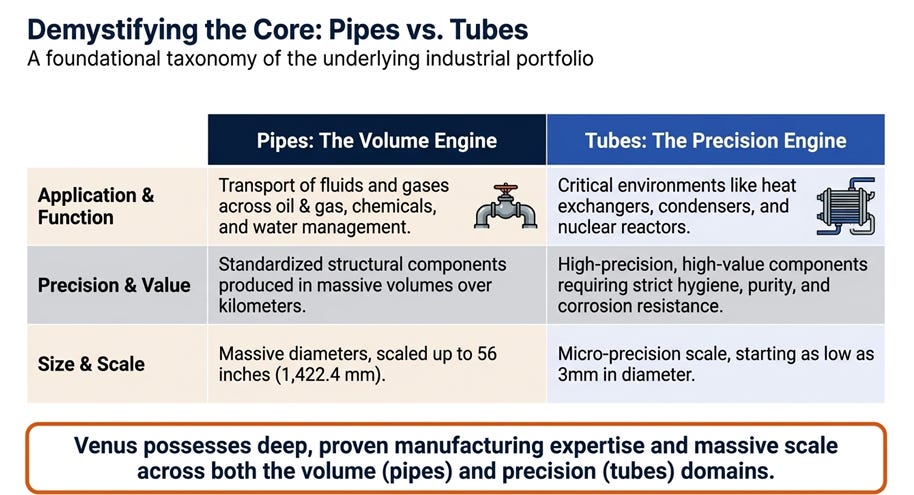
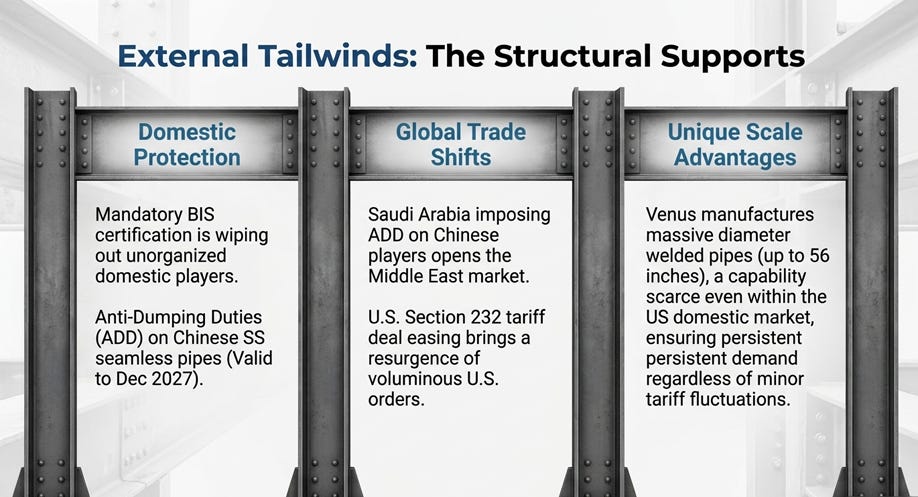
And Venus doesn’t just dabble. This company can manufacture welded pipes up to 56 inches in diameter — massive, the kind of capability that’s scarce even in the US market — and at the other end, specialised titanium welded tubes so exotic that only a handful of players worldwide can even attempt them.
Hold that thought. Because a company that can serve both ends of that spectrum has options most competitors can only dream about. It can chase volume when volume is available, and pivot to precision when margins matter. That optionality is the seed of everything that follows.
What Does Venus Actually Do? (The Full Value Chain, Simplified)
Venus Pipes & Tubes, at its core, makes stainless steel pipes and tubes through which water, oil, gas, steam, and chemicals move safely. But calling it a “pipe maker” today is like calling Amazon a “bookstore.” Technically true. Wildly incomplete.
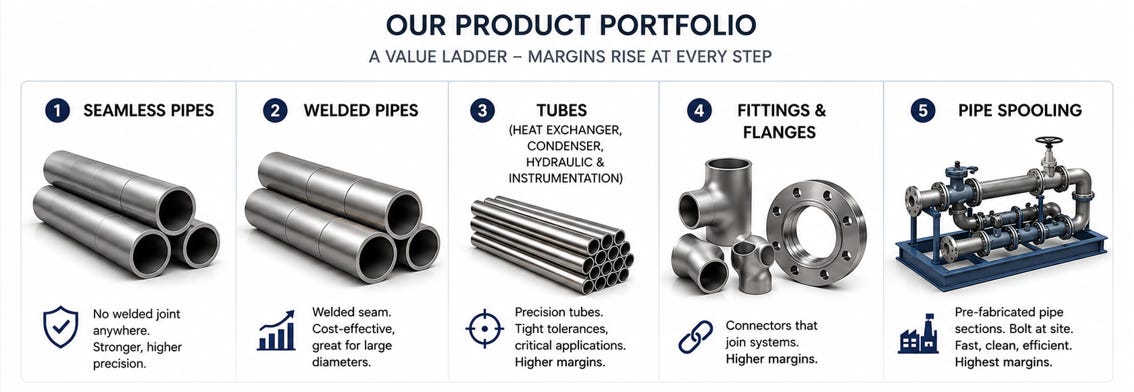
Here’s the full product range — think of it as a value staircase, with margins climbing at every step:
Seamless pipes — no welded joint anywhere in the cross-section. Think of them as formed from a single piece of steel, which makes them stronger under high pressure. Higher precision, higher margin than welded.
Welded pipes — formed by bending flat steel into a cylinder and welding the seam. Cheaper to make, great for large diameters. The volume engine of the business.
Heat exchanger tubes, condenser tubes, hydraulic & instrumentation tubes — the precision products that go inside refineries, power plants, and industrial equipment where failure is not an option. Small diameters, tight tolerances, significantly better margins.
Fittings and flanges — the connectors. A flange is simply a metal ring that bolts two pipes together firmly and lets you take them apart when needed. Unglamorous, but this is where margins start climbing noticeably.
Pipe spooling — the newest addition, and the one to pay the most attention to.
What on earth is spooling? Let me make it simple.
Imagine you’re building a huge industrial plant. Traditionally, you’d ship thousands of individual pipes and fittings to the site, and an army of welders would cut, weld, and assemble everything on location — slow, messy, exposed to dust and human error.
Spooling flips that entirely. You cut, weld, and assemble the piping into ready-made sections inside a clean, controlled factory. Then you ship those finished sections to the site, where workers simply bolt them together. Fast. Clean. Fewer errors. Less labour on site.
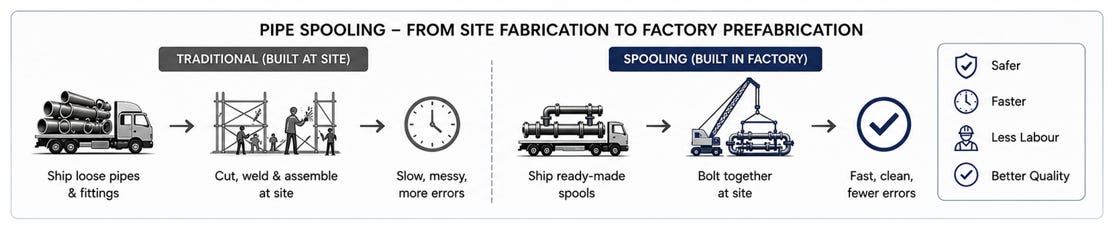
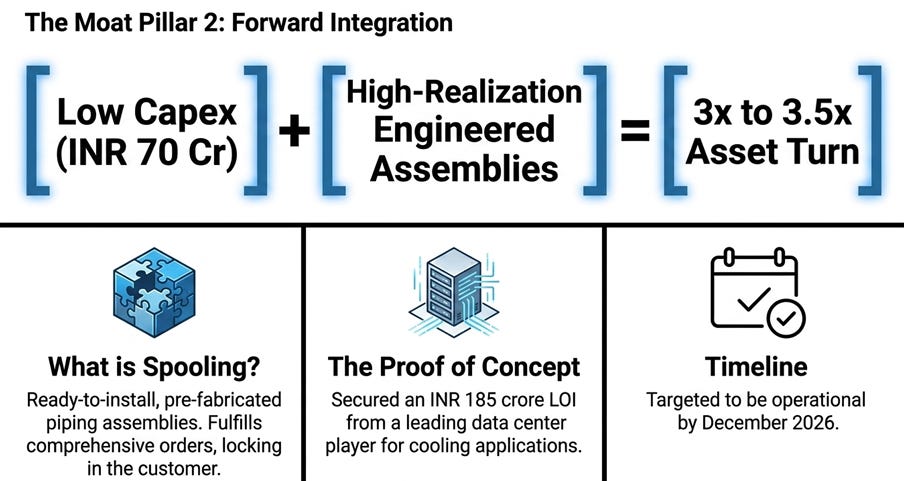
Venus’s own CFO has a neat analogy for this: he calls it “PEB for the piping industry” — Pre-Engineered Buildings, but for pipes. Just like PEB moved construction assembly from muddy sites into factories, spooling does the same for industrial piping. And like PEB, it carries meaningfully better margins than selling raw components.
So, the picture forming here is of a company climbing a value staircase — from making individual pipes, to making the connectors between them, to delivering complete ready-to-install piping systems. Every step up adds margin and customer stickiness. Keep that arc in mind. We’ll come back to it.
The Factory, The Ports, And Why Geography Is A Weapon
Venus runs a single integrated manufacturing campus — 2.6 lakh square metres at Dhaneti, Kutch, Gujarat. And this “everything in one place” setup is quietly a big deal.
Here’s why. When a demanding customer — say, an oil major or a Fortune 500 client — wants to inspect and approve a supplier, they send third-party inspectors to physically watch the manufacturing process. At Venus, an inspector can walk the entire journey — raw material to finished product — in a single visit, at a single location. That builds trust fast, and it simplifies the brutal approval cycles that plague this industry (more on those soon).
The location also sits close to the Kandla and Mundra ports — which matters enormously for a company that both imports raw material and exports finished product to over 30 countries. Lower logistics cost, faster turnaround, better efficiency versus competitors scattered across multiple sites.
There’s even an acid regeneration plant on-site, which lowers production cost and improves sustainability. Small detail, but it tells you management sweats the operational stuff.
And the export story is genuinely striking. In FY20, exports were around ₹6 crore. By FY26, exports have grown to roughly ₹400 crore, contributing about 34% of revenue. In a world where the rupee keeps weakening, being an export-oriented manufacturer is a structural advantage — your realisations improve without you lifting a finger.
The Clients Tell You Everything
There’s an old truth in manufacturing: you are who you supply. A company’s real quality isn’t in its brochure — it’s in its customer list.
Venus supplies to Reliance, Adani, IOCL, BHEL, and Tata Projects, among other industry heavyweights. It’s on the approved vendor list of more than 80 Fortune 500 companies. It has approvals from global giants like Abu Dhabi National Oil Company (ADNOC) in the Middle East.
Now, understand what these approvals cost to obtain. We’re not talking about sending a sample and getting a purchase order next week. In this industry, a new supplier is put through two to five years of small trial orders and relentless quality testing before landing any serious contract. These approvals take years. They’re not bought — they’re earned, painfully, one passed test at a time.
Which means every approval on Venus’s wall is also a wall around Venus’s business. It’s a moat disguised as a customer list.
Charlie Munger put it better than I ever could:
“The big money is not in the buying and the selling, but in the waiting.”
Venus spent years in the waiting room of these giant customers. Now it holds the credentials that newcomers simply cannot replicate on any reasonable timeline. That’s not luck. That’s a structural edge compounding quietly in the background.
And the corporate governance? I went looking for red flags — related-party games, promoter shenanigans, aggressive accounting — and came up clean. Promoters hold 48.41%, a healthy skin-in-the-game stake that aligns them with minority shareholders. Zero pledging. Nothing fishy in the shareholding pattern. For a small cap, that’s refreshingly rare.
This is the kind of setup my framework is built to find. I look for small-cap market leaders — businesses with a real moat, clean promoters with skin in the game, and a contrarian entry point where the market has the story wrong. When something clears all five filters, I take it apart completely. I share similar small cap setups every month within a Small Private Research Community — a group of people who'd rather read 20 pages than a 200-character tip. More on that at the end of this piece.
The Two Moats That Actually Matter
Every great business is protected by a wall. The question is always: how high, and how hard to climb?
Venus has been building two walls simultaneously — and the way they interlock is where this gets genuinely clever.
Moat #1: Backward Integration — The China Escape
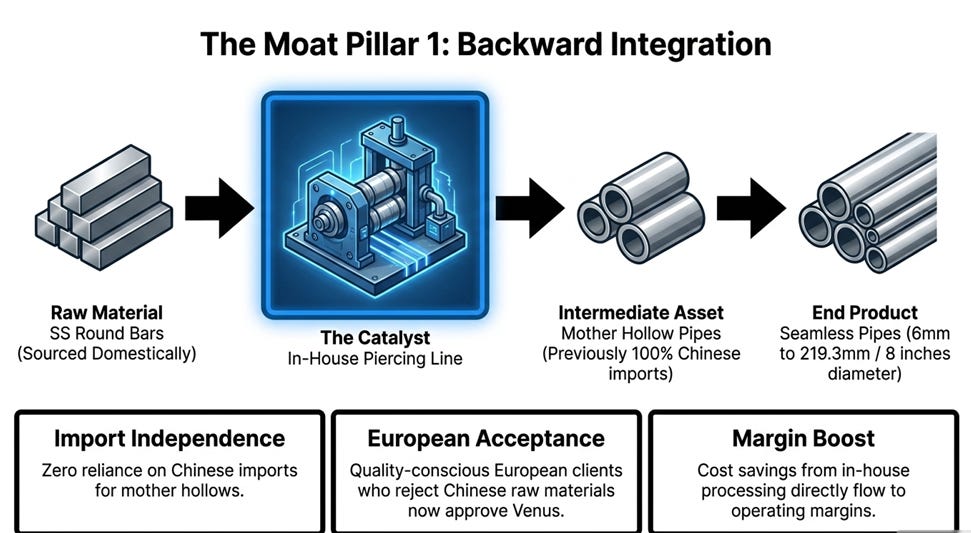
Here’s a fact that used to define Venus’s vulnerability. To make seamless pipes, you first need “mother hollow pipes” — the intermediate raw material. And Venus, like most of its Indian peers, used to import these from China.
That’s a dangerous dependency. Your cost, your quality, your delivery timeline — all held hostage to a foreign supply chain you don’t control.
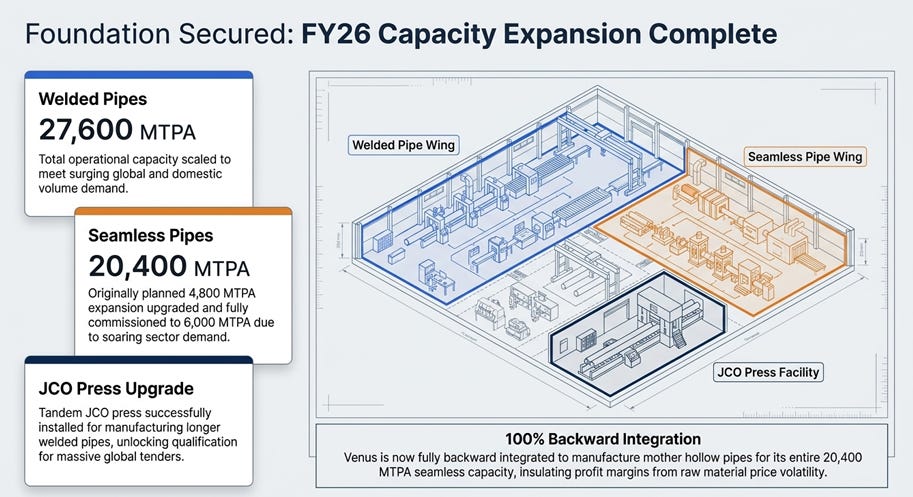
So, Venus built its own in-house piercing line technology and started manufacturing mother hollows itself. As of FY26, the company is 100% backward integrated for its entire 20,400 MTPA seamless capacity.
Read that again. Zero reliance on Chinese imports for its critical raw input.
What does that unlock? Three things: total control over raw material, better and more consistent quality, and faster delivery. But the sharpest benefit is on margins — the cost savings from in-house processing flow straight to the operating line. And there’s a bonus most people miss: quality-conscious European buyers who refuse to accept Chinese-origin raw material now approve Venus. Backward integration didn’t just cut cost — it opened a whole new export market.
Moat #2: Forward Integration — The Solutions Lock-In
While Venus pushed backward into raw materials, it also pushed forward into fittings and spooling. This is the “solutions provider” evolution.
When a customer can get raw pipes, fittings, and ready-to-install spool assemblies all from one supplier, they stop shopping around. Switching costs rise. Relationships get stickier. That’s customer lock-in — and it’s the kind of moat that gets stronger over time, not weaker.
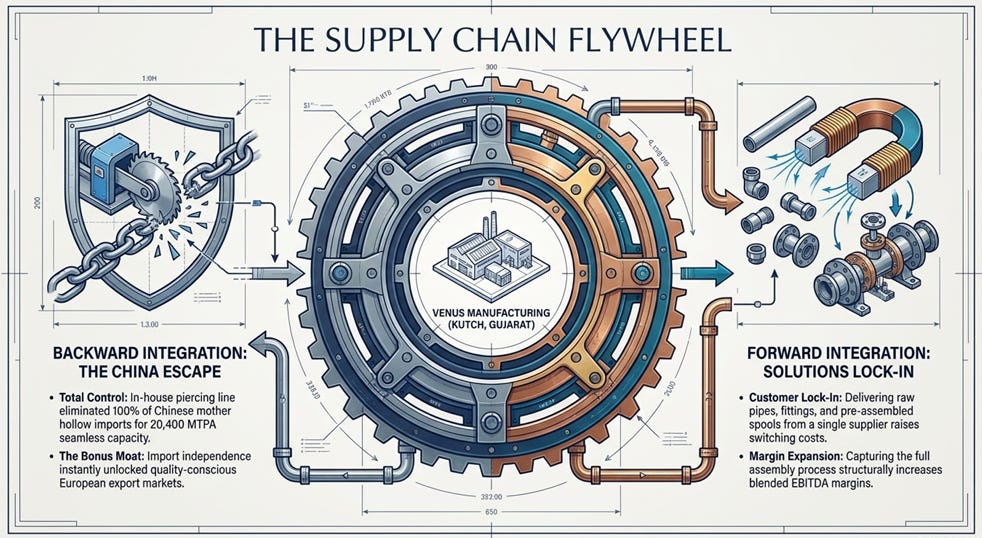
Put the two moats together and you have a company that controls its inputs and owns more of its customer’s wallet. Backward integration protects the base margins. Forward integration expands them. That combination is why I expect EBITDA margins to grind higher over the coming years — not through some heroic one-time event, but structurally, mix by mix, order by order.
And Three More Walls For Good Measure
Beyond integration, Venus sits behind the industry’s natural barriers:
Brutal approval cycles (2–5 years, as we discussed) that keep newcomers out.
High capital intensity — hundreds of crores for advanced machinery and backward integration. Not everyone can afford the ticket to play.
Stringent quality standards — BIS, IBR, ISO certifications that demand advanced testing labs, skilled engineers, and constant inspection. Fail these, and you don’t even get to bid.
And then there are the policy tailwinds working for organised players like Venus. Anti-dumping duties on cheap Chinese seamless and hollow pipes (valid to December 2027) have blunted the import threat. Mandatory BIS certification is quietly wiping out the unorganised, low-quality domestic players who can’t meet the standard. Even Saudi Arabia imposing anti-dumping duties on Chinese players is opening up the Middle East market. The whole structure of the industry is shifting market share away from the unorganised and toward the organised leaders. Venus is standing exactly where the tide is flowing.
But Wait — Where Does Venus Actually Sit in the Pecking Order?
Here’s a question worth asking before we go any further: if this business is so good, who’s already at the top of this industry — and why isn’t Venus there?
The honest answer is that Venus is not the biggest name in Indian stainless steel pipes. That title belongs to Ratnamani Metals & Tubes — a larger, older, more established company that most institutional investors reach for first when they want exposure to this sector. Understanding how Venus is different from Ratnamani is the fastest way to understand what Venus actually is.
The comparison comes down to four things.
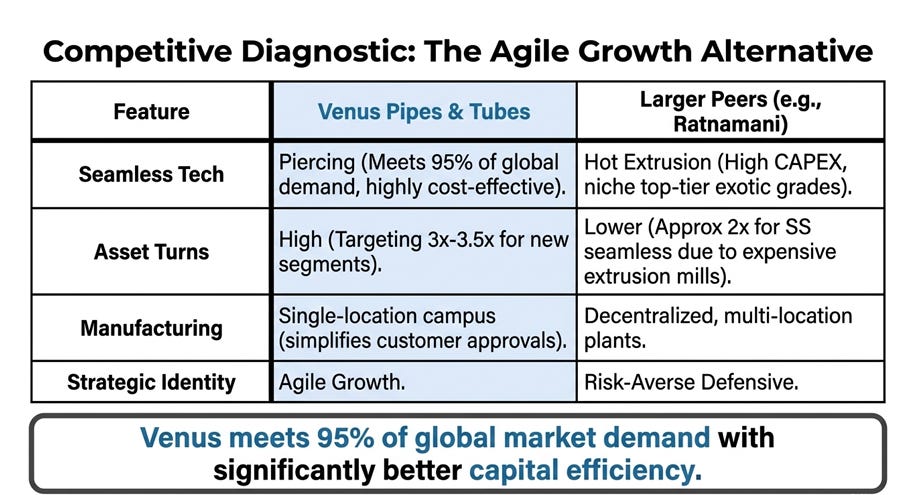
Technology. Ratnamani uses hot extrusion — an expensive, capital-intensive process that produces the highest-grade, most exotic pipe specifications. Think of it as the premium end: brilliant for the most demanding applications, but very costly to set up and run. Venus uses piercing technology, which management says covers roughly 95% of global market demand — at a fraction of the capital cost. Venus isn’t trying to compete with Ratnamani at the exotic end. It’s going after the large, profitable mainstream market with much better capital efficiency. Different tool, different target.
Capital efficiency. This is where Venus has a genuine edge over Ratnamani. Ratnamani’s heavy extrusion equipment means its assets generate roughly 2x revenue per rupee invested. Venus, in its newer segments, is targeting 3x to 3.5x asset turns. In plain terms: Venus squeezes more revenue out of every rupee of assets it owns. For a smaller, growing company, that matters enormously.
Manufacturing. Ratnamani runs multiple plants across different locations. Venus runs everything from a single campus in Gujarat — which, as we saw earlier, makes customer inspection visits simpler and faster. One visit, full picture.
Strategic character. Ratnamani is the established, conservative market leader — protecting its dominant position in high-end niches like nuclear. Venus is the faster-moving challenger — lighter, more capital-efficient, and actively pushing into new segments like data centres and fittings that Ratnamani hasn’t prioritised.
Now, to be fair — and this matters — Ratnamani’s position at the premium end is also a genuine strength, not just defensiveness. When a nuclear project or a critical refinery needs the most demanding pipe grades, they call Ratnamani. In its spooling business alone, Ratnamani reportedly earns EBITDA margins around 35% — because nuclear-grade work commands those numbers. Venus’s own MD was straightforward on the call when asked whether they’d chase nuclear: “There is still a lot of limitations there.” That’s honest, and it tells you Venus isn’t pretending to be something it isn’t yet.
So this isn’t David vs Goliath. It’s two companies deliberately playing different games on the same field — Ratnamani owns the premium exotic end, Venus is going after the large efficient mainstream with a data-centre pivot as its newest edge.
Here’s the question I find genuinely interesting: both companies are in the same sector, riding the same tailwinds. But they’re at very different stages of their cycles right now, trading at different valuations, with different risk-reward setups. Which one makes more sense to study today, at current prices, given where each is in its own story? That’s not something I can answer in a free article — the answer lives in the numbers, the concall signals, and the margin trajectory of each business studied side by side. But hold the question. It’s worth coming back to.
Now, The Part That Changes the Whole Story: The ₹185 Crore Data Centre Order
Everything so far has been foundation. Here’s where the ground shifts.
In the most recent earnings call, Venus revealed it has secured a ₹185 crore Letter of Intent (LOI) from a leading data centre player — to supply stainless steel pipe spools for cooling systems. This is the company’s first entry into the data centre space.
Now, why does this matter so much more than a normal order?
Because of what it signals. Venus won this contract before its dedicated spooling facility was even operational. Sit with that for a second. A data centre operator — running one of the most quality-paranoid environments on earth, where, in the words of MD Arun Kothari, a single penny of dust can destroy their CPU system — chose a company that hadn’t yet built the plant to fulfil the order.
Why? The management laid it out clearly on the call: it came down to Venus’s reputation, its existing welded pipe capacity across major SKUs, its newly added fittings capability, and its ability to execute fast. The customer saw the facility, saw the quality, saw the growth — and trusted Venus to deliver.
To capture this opportunity, Venus is investing roughly ₹70 crore in a dedicated spooling and fabrication plant, fittings machinery, and related infrastructure. The CFO expects this business to deliver an asset turn of around 3x at full utilisation, with margins higher than the company’s current blended level. Whole-Time Director Dhruv Patel framed why spooling is strategically special: it moves Venus up the value chain, carries better realisation and stronger margins than standalone pipes, and improves utilisation of the existing welded pipe and fittings capacity. One move, three wins.
The facility is targeted to be operational by December 2026, with trial runs finishing in Q2 and commercial production expected around mid-Q3 FY27. The ₹185 crore order is executable over roughly 15 months.
One thing worth stating plainly before we move on: this is still a Letter of Intent, not a firm purchase order. Management expects it to convert once the facility is live and the formal order is raised. It’s early-stage validation of a new capability — treat it as a proof of concept, not as booked revenue. The investment thesis doesn’t hinge on this one order converting; it hinges on what winning this LOI says about the company’s positioning — and on the multiple other triggers building alongside it.
Here’s the mental leap I want you to make. This isn’t a company hoping to enter a hot sector. This is a company that got pulled in by a customer who came looking. That’s the difference between chasing a trend and being chosen by one.
And data centres are just the doorway. Let me walk you through the full map of what’s building behind it — because this is where the title of this piece earns its keep.
The Growth Triggers Beyond Data Centres
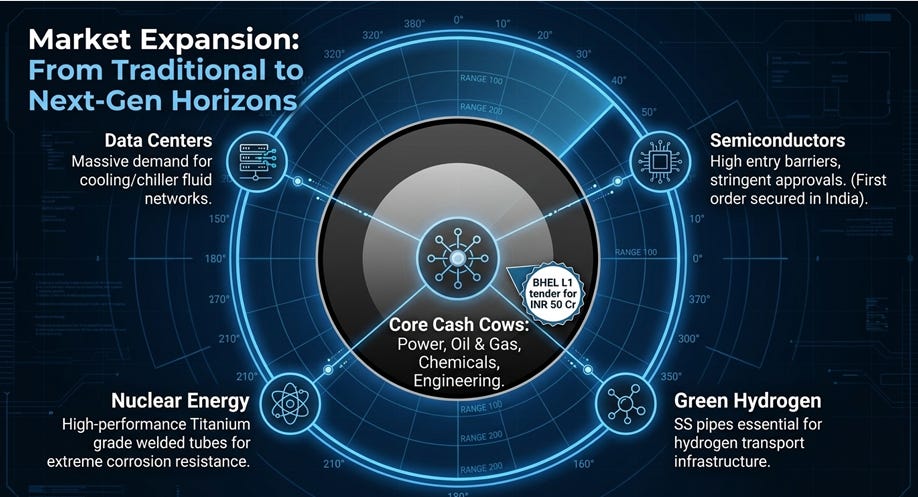
Semiconductors. Every semiconductor fabrication plant — a “fab” — needs ultra-pure cooling and process piping that is essentially contaminant-free. Even a microscopic particle in the fluid network can ruin an entire wafer batch worth crores. That’s exactly the environment Venus’s precision tubes are built for. India’s semiconductor push is in its early stages, but the approvals Venus is accumulating from global industrial clients are the same quality credentials a semiconductor fab would demand. Management flagged this explicitly on the call as an emerging inquiry pipeline — not a booked order yet, but the kind of enquiry that turns into a contract once a facility is under construction. The entry barriers here are ferocious, which is precisely why being on the right approved vendor lists early matters so much.
BHEL and the power sector. This one is already converting. On the most recent earnings call, MD Arun Kothari confirmed that Venus is already L1 (lowest bidder, first in line) on an INR 50 crore BHEL tender — meaning that order is essentially incoming within 30-45 days. Beyond that, Venus has bid on multiple new tenders opening between August and September 2026. Management expects to be receiving BHEL orders at a meaningfully accelerated pace by Q2 FY27. BHEL itself is ramping up its fabrication capacity to clear a backlog of orders from the big power players — which means the pipeline of BHEL-linked demand for Venus pipes is structurally larger than it’s been in years. Power, oil and gas, chemicals, and engineering remain the core cash cows funding everything else. They aren’t glamorous. But they’re the engine that’s been running quietly while the new-age narrative gets all the attention.
Green Hydrogen. Stainless steel pipes are non-negotiable for hydrogen transport and storage infrastructure — hydrogen is highly reactive and corrosive, and mild steel simply can’t handle it safely. As India’s green hydrogen mission gains traction, the pipe specifications required map directly onto what Venus already makes. This isn’t revenue today. But it’s a sector where the technical requirements naturally filter out low-quality players and reward exactly the kind of certifications Venus has spent years accumulating.
Nuclear Power — The Long Game. This one deserves honesty. When asked directly on the call whether Venus could chase nuclear-grade spooling (where the larger incumbent earns ~35% EBITDA margins), MD Kothari was straightforward: “There is still a lot of limitations there.” Nuclear requires a different regulatory clearance stack entirely, and the incumbent’s hot-extrusion technology has a structural advantage in the most exotic grades. Venus is not a nuclear play today — and I won’t dress it up as one. But the spooling capability it’s building for data centres is the same foundational infrastructure that would eventually be adapted for nuclear cooling. It’s a long-dated option, not a near-term trigger. Worth knowing it exists; not worth paying for it yet.
The full picture then looks like this. Four distinct growth engines running in parallel — data centres (first order landed, facility building), semiconductors (approvals accumulating, enquiries coming), power/BHEL (orders imminent), green hydrogen (structural tailwind, medium term) — with nuclear as a long-range aspiration on the horizon. The traditional sectors (oil & gas, chemicals, fertilisers) fund the whole enterprise while the new-age segments ramp. That layering is what makes the thesis genuinely interesting — if any two or three of these fire together, the operating leverage from that idle welded capacity could drive a sharp earnings inflection.
Howard Marks has a line that fits this moment perfectly:
“Being too far ahead of your time is indistinguishable from being wrong.”
The risk with a story like this is getting seduced by the sizzle and forgetting the steak. So, let’s cool down the hype and actually check the numbers. Because a beautiful narrative attached to a broken business is just an expensive way to lose money.
Before we go further — a quick word on how I find setups like this.
My framework is simple: small-cap market leaders, real moat, clean governance, contrarian entry, identifiable triggers. When something clears all five, I go 10 to 15 times deeper than any article can in a descriptive professional report — full segment model, concall deconstruction, capital allocation traced across a decade. 20 to 25 pages, built from scratch.
You just read about Ratnamani briefly — the established, higher-margin player in the same sector. What this article couldn’t cover is the part that actually matters for an investor right now: where Ratnamani sits in its own cycle, what its current valuation implies, what the concall signals about its next leg, and whether the risk-reward on that business today is more or less interesting than Venus at current prices. That side-by-side — two companies, same sector, different setups, different growth triggers — is exactly the kind of work that takes three weeks and twenty-five pages. It doesn’t fit in a Substack article.
This month’s deep-dive inside the Small Cap Research Club is that work — Ratnamani, taken all the way down. Same framework. Same honesty about what’s expensive and what isn’t. If the sector interests you, the comparison is worth reading.
Not only that you will receive the library of all reports of similar small cap setups that are worth studying.
That’s the Small Cap Research Club. You can get a 20% on the annual membership -the offer which will be valid for the next 2 days- use code ROHIT20 during checkout.
I share 2-3 similar deep dives per month. No tips, no calls. Just structured research for people who think in years. Continuing below
The Capex Story — Or, Why The Last Seven Years Were The Setup
Most investment articles gloss over capex history. They show you the headline number and move on. I think that’s a mistake here — because the capex story is the single most important thing to understand about Venus Pipes. Everything else flows from it. So let me slow down and walk you through it properly.
Here’s the simplest possible version first. Imagine a farmer who spends seven years clearing land, digging irrigation channels, buying machinery, and planting orchards. During those seven years, his expenses are high, his cash is tight, and the orchard produces almost nothing. Anyone watching from the outside sees a man spending a lot of money with very little to show for it. Then the orchards mature. Suddenly the same farmer is sitting on fully-grown trees, zero need for more planting investment, and fruit coming in season after season at very low incremental cost.
Venus just walked off the field and entered the orchard.
The Numbers First
In FY19, Venus had finished product capacity of 6,900 metric tonnes per year. That’s the starting line. By FY26, that number stands at 48,000 metric tonnes per year. A 7x expansion in seven years. And here’s the number that tells you how seriously they built: fixed assets went from ₹10 crore to around ₹400 crore — a 40x increase. The company didn’t just add a room to the house. It built a new house seven times bigger than the old one.
How It Actually Happened — Wave by Wave
This wasn’t one big bet. It was a series of deliberate, sequenced moves — each one funded and absorbed before the next began. That sequencing matters, because it’s the difference between disciplined capital allocation and reckless expansion.
Wave 1 — Building the welded foundation. The early years focused on expanding welded pipe capacity. Welded pipes are the volume engine — they fund everything. Venus grew this steadily while accumulating customer approvals.
Wave 2 — The China escape. This is the single most strategically important investment Venus ever made. To make seamless pipes, you need an intermediate raw material called “mother hollow pipes.” For years, Venus imported these from China — which meant every time China’s prices moved, or supply tightened, Venus felt it immediately. The cost, the quality, the delivery — all outside Venus’s control. So management installed an in-house piercing line — a machine that manufactures mother hollows directly from domestic stainless steel round bars. As of FY26, Venus is 100% backward integrated for its entire 20,400 MTPA seamless capacity. Zero Chinese imports. What did this unlock beyond the obvious cost saving? European buyers — who are extremely quality-conscious and many of whom refuse to accept products made with Chinese raw material — now approve Venus. A supply-chain decision quietly opened an export market. That’s not efficiency. That’s strategy.
Wave 3 — The seamless push, upgraded mid-cycle. The original plan was to expand seamless capacity by 4,800 MTPA. But as the build was underway, management read the demand environment and made a call: they upgraded the expansion to 6,000 MTPA instead — adding two separate tranches (1,800 MTPA operational in November 2025, 4,200 MTPA commissioned on the day of the FY26 earnings call itself). This kind of mid-cycle upgrade is worth noticing. It tells you management has enough conviction in near-term demand to accelerate spending — they weren’t being cautious, they were being opportunistic. The final seamless capacity now sits at 20,400 MTPA, fully backward integrated.
Wave 4 — Forward integration: fittings and the JCO press. The most recent additions are about climbing the value chain, not just adding volume. First, a dedicated fittings plant — now fully commissioned. Fittings are the connectors between pipes (the flanges, elbows, tees), and selling them alongside pipes means Venus captures more wallet share from the same customer. Second, a tandem JCO press — a piece of equipment that makes longer welded pipes with fewer joints. Why does length matter? Because large industrial tenders — power plants, desalination projects, global infrastructure — often specify long-run pipe lengths that very few manufacturers in India can produce. The JCO press puts Venus on the bidding list for tenders it previously couldn’t even enter. The CFO confirmed on the call: it’s essentially already operational.
How Was All This Funded?
Honestly — through a combination of equity dilution and borrowings. The company raised capital multiple times over the seven years, diluting existing shareholders each time. And debt has risen from ₹29 crore in FY19 to ₹197 crore today.
I want to be straightforward about this rather than gloss over it. The dilution was value-accretive — capacity grew 7x, fixed assets grew 40x, and revenue went from ₹120 crore to ₹1,167 crore. Shareholders who stayed got a much bigger, much more capable business in exchange for their dilution. The debt, at a 0.29 debt-to-equity ratio, is well within manageable territory — and with the capex cycle now over, management expects it to start declining. But the history of equity raises is worth knowing because it’s part of how the flat PAT happened: new shares in the denominator, new depreciation and interest on the income statement, and fresh capacity not yet fully utilised. All three press down on return ratios simultaneously. All three should reverse as the harvest begins.
The Quiet Signal Most People Missed
Venus also recently acquired 15 additional acres of land adjacent to its existing campus. No new capex announced. No new capacity added. Just land sitting there.
In manufacturing, land acquisition is management’s way of signalling future intent without committing to a timeline. They’re optioning their own future. Read it as: we expect to need this eventually, and we’d rather own it cheap now than compete for it later. It’s a long-dated option on the next growth phase, purchased quietly while the current phase consolidates.
The Operating Leverage That’s Now Loaded
Here’s what the build means in practical terms going forward, and I want to make this vivid rather than abstract.
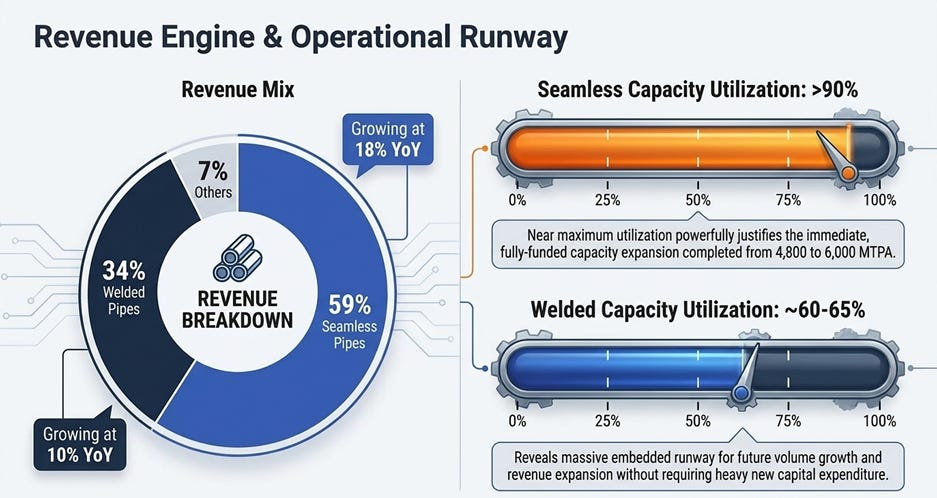
Venus’s welded pipe capacity is currently running at only 60-65% utilisation. Seamless is already maxed out at 90-95% — so that line is earning its keep. But welded has roughly 35-40% of capacity sitting idle right now. Think about what that means financially.
The plant is built. The machinery is paid for. The workers are employed. The lights are on. The depreciation is being charged to the P&L whether Venus uses the capacity or not. So, every additional tonne of welded pipe that gets produced and sold from here flows through at essentially zero incremental fixed cost. The revenue goes up. The variable costs (raw material, power) go up a little. But all the heavy fixed costs — the rent, the depreciation, the core workforce — barely move. That gap between rising revenue and flat fixed costs is what accountants call operating leverage, and it’s what investors call the moment profits start to accelerate.
To put numbers on it roughly: if Venus fills its welded utilisation from ~65% to ~85% over the next two to three years — without spending another rupee on new capacity — the incremental contribution at the EBITDA level flows through at a much higher margin than the current blended 16.3%. That’s how margin expansion happens structurally, without heroic assumptions. The orchard is planted. It just needs to be harvested.
The Financial Autopsy: What The Numbers Actually Say
Everything so far has been about what Venus is. Now let’s look at whether the numbers back any of it up — because a compelling story attached to a broken business is just an expensive way to lose money. This is where a lot of exciting small caps fall apart. Let’s see if Venus does too.
The Growth Track Record
Revenue: roughly ₹120 crore in FY19 → about ₹1,167 crore in FY26. That’s an ~40% revenue CAGR over eight years.
PAT: ₹4 crore in FY19 → around ₹112 crore in FY26. A ~60% PAT CAGR.
EBITDA margins: from ~7% in FY19 to a stable ~16% today, oscillating in the 13–16% band.
Notice something? PAT grew faster than revenue — 60% vs 40%. That gap is the fingerprint of two beautiful forces working together: margin expansion (better product mix) and operating leverage (fixed costs spread over more volume). When you see PAT outrunning revenue like this, over years, it usually means the business is genuinely getting better, not just bigger.
Now, a note of honesty, because I won’t sell you a fairy tale. Some of this glorious CAGR is flattered by a tiny base — going from ₹4 crore to ₹112 crore PAT looks spectacular partly because ₹4 crore was so small. Don’t extrapolate 60% forever. That would be naïve.
The Latest Quarter, Decoded
The most recent results (Q4 & FY26) told a nuanced story that rewards careful reading:
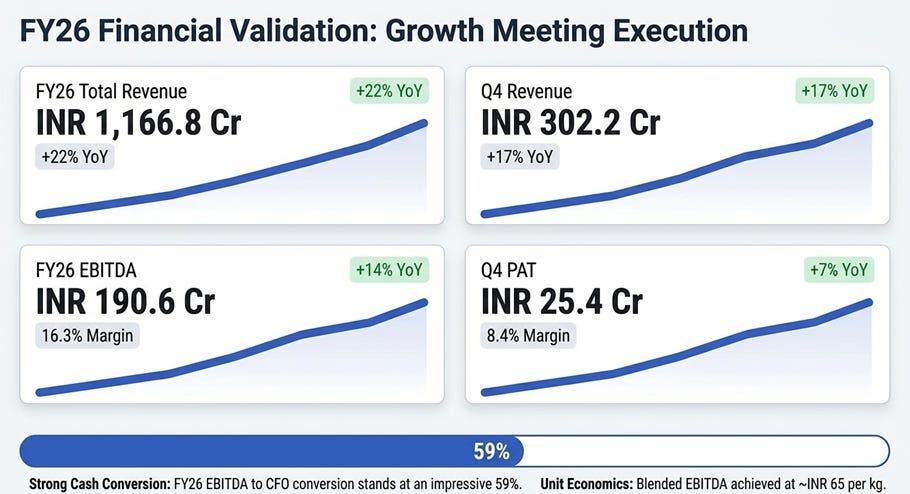
FY26 revenue: ₹1,166.8 crore, up 22% — genuinely strong given the year’s chaos.
FY26 EBITDA: ₹190.6 crore at a 16.3% margin.
Q4 revenue: ₹302.2 crore (+17% YoY), Q4 PAT ₹25.4 crore (+7% YoY).
Exports: grew 18% for the full year despite a rough patch.
But here’s the honest wrinkle the management didn’t hide. Q4 exports actually fell — ₹87.8 crore versus ₹112.5 crore a year earlier — hit by the Middle East conflict disrupting shipments. And an analyst caught a subtle point: Q4 volume growth was only 1-2% quarter-on-quarter; most of the reported growth was pricing/realisation, not volume. Full-year volume growth was healthier at ~15% (seamless ~18%, welded ~10%).
And now we arrive at it. The first number I asked you to hold onto right at the very top.
Because here’s what the analysts pressed hard on, quarter after quarter: PAT has been stuck in that ₹25-26 crore range for nearly nine quarters straight. Revenue keeps climbing, capacity keeps expanding, hundreds of crores keep going into the ground — and the profit line just… sits there. Flat. To a screen-scanning investor, that’s an open-and-shut case. Money going in, profit not coming out. A business quietly treading water while management talks a big game. Sell.
But stop and ask a different question. Why is the profit flat?
Here’s what’s actually been happening. For seven years, Venus has been in a brutal build cycle — pouring cash into new plants and machinery, running fresh capacity that isn’t yet full, absorbing the start-up costs of fittings and backward integration, all while the depreciation and interest from that spending hits the P&L immediately — but the revenue those new assets will eventually produce shows up only later. That’s not a company decaying. That’s a company that front-loaded all the pain of expansion and hasn’t yet collected the reward. The flat PAT isn’t the tombstone. It’s the coiled spring — held down, precisely, by the very investment that’s about to stop being a drag.
And this is the crux the whole thesis turns on. Management was blunt about it on the call: the major capex is done, the resources will now flow into production, the new projects are all value-added, and PAT should begin breaking out quarter by quarter from here. The bull sees a spring about to release. The bear sees a company that keeps spending without ever accelerating. Both are staring at the identical nine-quarter chart. The difference is whether you read “flat profit” as the end of the story or the setup for the next chapter.
I’m not going to tell you which reading is right — that’s yours to decide, and it’s exactly what you’ll want to track every single quarter. But notice what just happened: the number that looks most like a weakness on a screener is, on closer inspection, the most explainable number in the business. That’s usually where mispricing hides — in the figure the crowd reads at face value and never interrogates.
Hold that thought. Because there’s a second number that pulls the same trick.
The Balance Sheet & Cash Flow — The Warts Included
Debt: ₹197 crore. Debt-to-equity of 0.29. Manageable — not scary — but worth monitoring. Management expects it to trend down now that capex is largely behind them.
Zero pledging. Clean.
Cash: ~₹29 crore.
Reserves: from ₹3 crore in FY19 to ₹648 crore today.
And here it is — the second number I told you to keep in your pocket. Cash flow conversion.
I calculated the CFO/PAT ratio from FY20 to FY26, and it lands at roughly 51%. In plain English: for every ₹100 of accounting profit Venus reported, only about ₹51 actually showed up as cash in the bank. For a B2B business, my personal minimum threshold is around 60%. So on this metric, Venus falls short — and a careful investor’s alarm should absolutely go off here. On a screener, a sub-60% conversion number is the kind of thing that makes you close the tab.
But — and you can probably feel the pattern by now — ask why before you judge.
Two reasons, and neither is decay. First, this is a genuinely working-capital-hungry business: net working capital runs around 120 days, meaning a lot of cash is permanently tied up in inventory and receivables as the company grows.
Second — and this is the big one — Venus just spent seven years in a capex marathon that ate cash by design. When you’re building plants and stuffing warehouses to feed new capacity, cash conversion always looks ugly. It’s supposed to. The tell that it’s a phase and not a permanent condition: management’s own FY26 EBITDA-to-CFO conversion came in at 59% — already climbing back — and with the capex now behind them, the cash that was flowing out to build should start flowing in from what’s been built.
So this is the honest verdict, and I want to be precise about it: this is not a red flag. It’s an amber flag — a number that’s genuinely below par today, with a credible reason to improve, and therefore exactly the thing you monitor rather than ignore. If conversion is still stuck near 51% two years from now with capex long finished, the story is broken. If it drifts toward 65-70%, the spring released. That’s the test.
“Should” is doing a lot of work in that paragraph, and I won’t pretend otherwise. Take it on evidence, not faith — quarter by quarter.
So there they are. Both numbers I planted at the start, now disarmed and explained. The flat profit and the weak cash conversion are the two things a screener flashes red — and both turn out to be the fingerprints of a company finishing a build and about to start a harvest. Maybe the crowd is right and it’s a value trap. But at minimum, the two scariest-looking figures in this business are also its two most misunderstood. And misunderstanding, as every contrarian knows, is where the opportunity lives — or the trap. Your job is to decide which.
Pulak Prasad — one of the finest investors India has produced — has a principle I keep coming back to:
“We are extremely reluctant to sell. Our default holding period is forever, but only for the right business bought at the right time.”
The “right business” part, Venus arguably clears. The “right time” part — the valuation — is where we go next. Because a wonderful business can still be a terrible investment if you overpay.
Let's Talk Valuation — Honestly
I’m not going to give you a price target. Nobody knows what a stock is worth to the rupee, and anyone who says otherwise is selling something. What I can do is walk you through how to think about whether today’s price is justified — and where the honest limits of that thinking are.
Let’s start with the basic facts as they stand today, and I’ll explain each number in plain terms:
Market Cap: ~₹3,516 crore. This is what the whole company costs to buy at today’s price. Small cap by any definition — which is exactly where mispricing tends to hide.
P/E ratio: ~34.4x. For every ₹1 of annual profit Venus earns, the market is willing to pay ₹34.4. Is that cheap? No. Is it expensive? Depends entirely on how fast you expect the profit to grow.
PEG ratio: ~1.06. This is the P/E divided by the growth rate — it adjusts the “expensive” question by asking whether the growth justifies the price. Peter Lynch’s rule of thumb was anything under 1.5 is acceptable; I’m comfortable up to 2. At 1.06, Venus is paying a fair price for the growth it’s expected to deliver — not a bargain, but not egregious either.
EV/EBITDA: ~18.2x. A different angle on valuation — compares the total enterprise value (market cap plus debt, minus cash) to operating profit. For a growing industrial manufacturer with real moats, 18x is reasonable.
ROCE: 22.5% | ROE: 17%. These tell you how well the business uses the capital it has. A 22.5% return on capital employed is genuinely good — and the case for this expanding further as the capex cycle ends is structural, not speculative.
Price to Book: 5.27x | Price to Sales: 3.01x | Debt/Equity: 0.29 | Pledge: 0%.
So — putting it together plainly: is Venus cheap? No. Let’s be direct about that. At 34x earnings and 5.27x book, you are not picking up a rupee for fifty paise. This is not deep-value investing.
But “not cheap” and “expensive” are different things. Look at the broader capital goods universe — the ABBs, Siemens, Hitachi Energys, APL Apollos of the market. Many of these trade between 50x and 100x earnings. Hitachi Energy has been north of 150x. Against that context, a quality manufacturer with a genuine growth runway at 34x looks reasonable — arguably sensible — if the growth delivers.
The PEG ratio of 1.06 is the number I keep returning to. It says: at current growth rates, the valuation is broadly justified. You’re not getting a screaming deal. But you’re not being asked to pay for a dream the business hasn’t earned either.
There’s also a case for the multiple expanding from here. When a company exits a heavy capex cycle, three things happen simultaneously: depreciation stops growing, interest costs decline as debt falls, and utilisation of the new capacity climbs. All three push margins higher. Higher margins on a growing revenue base tend to attract valuation re-rating. That’s the operating leverage flywheel — and it’s structural, not a hope.
David Dreman, one of the great contrarian investors, had a warning that fits this exact moment:
“Investors’ emotions almost guarantee that they will buy at the top and sell at the bottom.”
A stock like this trades on momentum and narrative, not on deep fundamental undervaluation. That changes the temperament required to own it. This is a track it every quarter, read every concall, know your exit before you enter kind of name — not a buy-and-forget position. If a quarter disappoints, the correction can be sharp and swift. The higher the valuation, the higher that risk. That’s the honest deal you’re accepting.
Where Could The Numbers Go?
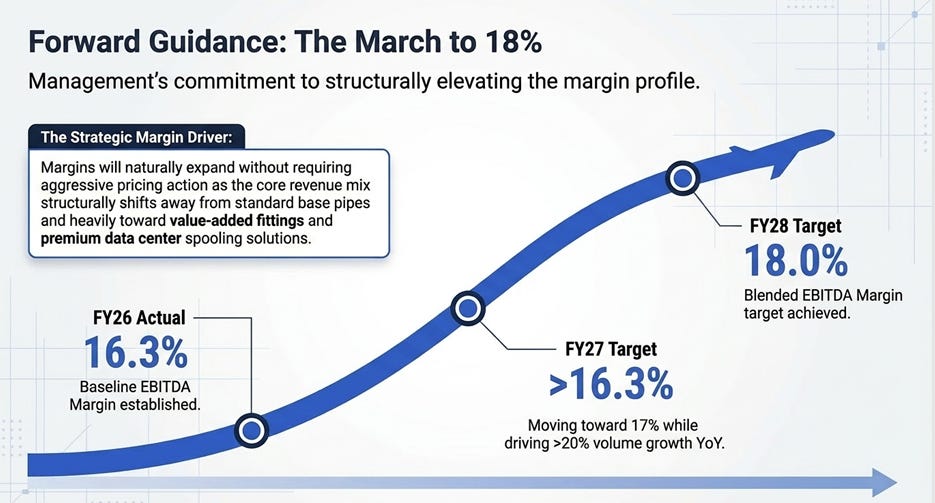
Management has guided for 20%+ volume/revenue growth through FY28, with EBITDA margins moving from ~16.3% toward 18% by FY28. On a broad, crude basis — and I stress do your own math, don’t lean on mine — revenue in the ₹2,500-3,000 crore range and PAT somewhere around ₹250-350 crore by 2030 is a plausible envelope if market share gains, operating leverage, and margin expansion all play out. Emphasis on if.
The Risks — Because Ignoring Them Is How You Lose Money
Every thesis has an anti-thesis. If you can’t argue the bear case, you don’t really understand the bull case. Here’s what could go wrong:
Geopolitical & trade risk. US tariffs, Middle East disruption (already visible in Q4 exports), and — critically — the anti-dumping duty on Chinese imports expires in December 2027. If it’s not renewed, cheap Chinese product could flood back and reignite competition.
Technology ceiling risk. As we saw in the pecking-order comparison, Venus’s piercing technology covers ~95% of applications — but the exotic, highest-margin niches (critical refinery grades, nuclear) still belong to the hot-extrusion incumbent. If demand tilts toward those segments faster than expected, Venus’s upside in the premium end is capped.
Execution & approval risk. New products like fittings and spooling need 2-3 years of approvals. Delays hit capacity utilisation. And that ₹185 crore data centre order? It’s still an LOI — a Letter of Intent — not a firm purchase order yet. Encouraging, but not banked.
Financial & working capital risk. This is a working-capital-hungry, cyclical business. Rising ocean freight, RM inflation, high interest rates — any of these can squeeze margins.
Valuation risk. Small-cap valuations across the market are elevated. A sharp correction — in the US or in India — would drag this along with it, regardless of business quality.
I flag these not to scare you off, but because a thesis you can’t stress-test isn’t a thesis — it’s a hope.
The Bottom Line — And The Puzzle, Solved
Let’s go back to where we started. Two facts that seemed to contradict each other: a data centre betting crores on an unbuilt plant, and a profit line frozen for nine quarters. One of them, I said, had to be lying.
Here’s where I’ve landed — and you’re free to disagree. The two aren’t in conflict at all. They’re the same story told from two ends. The data centre saw a company whose seven-year build is finished and whose capability is real. The frozen profit is simply what the final stretch of that build looks like on an income statement before the harvest begins. The market is reading the second fact as decay. I read it as a spring under load. Whether it releases is the open question — but “flat PAT” and “weak cash conversion” are not the crimes a screener assumes them to be. They’re the fingerprints of a company finishing one phase and stepping into the next.
So let me run Venus through my five filters plainly, the way I score every business before I’ll spend three weeks tearing it apart. No hiding the weak boxes.
Small-cap. ✅ Market cap ~₹3,516 crore. Small enough that the big institutional money hasn’t fully picked it over — which is precisely where mispricing can still live.
Market leader. ✅ A growing leader in its niche, the first stainless steel pipe player in India to win an AI data centre cooling contract, on 80+ Fortune 500 vendor lists. Not the third player hoping to catch up.
Reasonable valuation. ⚠️ The honest one. At ~34x earnings and 5.27x book, it is not cheap. It’s reasonable-for-the-quality if the growth lands — but this is not deep value, and I won’t dress it up as such.
Contrarian setup. ✅ The market files it under “boring commodity pipes” and reads its two scariest numbers backwards. The gap between that perception and what management is actually building is the entire opportunity.
Moats + visible triggers. ✅ Backward integration (China escape), forward integration (solutions lock-in), brutal approval barriers — plus concrete triggers stacked across multiple sectors: first mover in AI cooling spooling (LOI as early validation, not the whole thesis), BHEL tenders already converting, semiconductor enquiries building, idle welded capacity as loaded operating leverage, and the structural march toward 18% margins by FY28.
Four clean ticks, one honest caveat. That’s a rare scorecard — and it’s exactly the kind of setup that makes a business worth understanding deeply while the crowd is busy being afraid of the word “pipes.”
But notice what filter three forces us to admit. The stock isn’t cheap. Cash conversion still has to prove itself. PAT hasn’t broken out yet. The richest data centre revenue is a couple of years out. This is an execution-and-tracking story, not a buy-and-forget one — the kind of name you follow quarter by quarter, reading every concall, knowing your own exit before you ever think about an entry.
I’ll leave you with Munger, because it’s the only lens that finally matters here:
“A great business at a fair price is superior to a fair business at a great price.”
Whether Venus is that great business bought at a fair price — that’s a conclusion only you can reach, with your own work, your own models, your own risk tolerance. This piece is a map, not a destination. Go verify every fact. Study the promoters. Build your own growth model. Be fully responsible for your own decisions — because this is education, not a buy, sell, or hold recommendation of any kind.
Now — if you want to see what it looks like when I dissect a business all the way down to the, and score all five of those filters with the depth a screener can never give you...
Before You Go — The Research That Goes 10x Deeper
The reader who understood a seven-year build cycle quietly flipping to harvest before the profit line broke out and the market noticed — had months of runway before the story became consensus. You are now at that exact type of inflection point with Venus. Multiple sectors lining up simultaneously. PAT structurally set to break. The kind of setup where the article gives you the map but the report gives you the terrain.
What this article could not cover: the concall deconstruction layer — what management actually signalled beneath the surface versus what they said out loud. The operating leverage math modelled properly at the segment level. The capital allocation history traced year by year to understand whether this management team has earned the benefit of the doubt when they say PAT will break out. The structured quarterly risk framework that tells you exactly which numbers to watch and what would change the thesis. That work takes three to four weeks per business. It doesn’t fit in an article.
That’s where the Small Cap Research Club comes in. Let me tell you exactly what it is — and just as importantly, what it isn’t.
What it is not: No buy/sell calls. No “exit at ₹X” messages. No daily alerts pinging your phone. No guaranteed-return claims. If that’s what you’re after, it exists elsewhere cheaply and everywhere. This isn’t that.
What it is: A private research library with three distinct things arriving every month.
1. Two to Three full company deep-dives (20–25 pages) - Carefully chosen under-covered Indian businesses, taken all the way down to the core. Original work — written from scratch, not scraped from broker notes. Each report covers the full picture a serious investor needs:
Business-model dissection — segment-level revenue, end-market exposure, why this company occupies its specific position
Capital allocation framework — how management has deployed capital historically, and the multi-year ROCE trajectory
Moat analysis — the structural advantages that explain the margin profile, and what would erode them
Concall deconstruction — not a transcript summary, but a structured read of what management actually signalled versus what they said on the surface
Structured quarterly risk framework — the specific numbers to watch and what would change the thesis
2. One sector deep-dive with a personal watchlist- Once every 2 months, a full sector study — where the capital cycle is forming, which segments are worth watching, which are entering crowded-trade territory. Includes a curated watchlist of names I’m personally tracking, with the setup explained for each.
3. Email Q&A access Write in with questions on any of the research published. I respond personally — typically within 48 hours. Not personalised portfolio advice, but if there’s something in a report you want to dig deeper on or a concept you want clarified, the channel is open.
Every past report permanently archived — the library compounds the longer you stay.
On Telegram: The reports are delivered on a private Telegram channel — purely for convenience and archival. I want to kill one misconception upfront: this is not a calls-and-tips group. There are no “buy this today” messages, no stock alerts, no morning market noise. Think of it as a quiet, indexed research library that happens to live on Telegram. Every report is pinned and searchable. You open it when you want to study, not because something pinged you at midnight. If you’re looking for real-time trade signals, this is genuinely the wrong place — and I’d rather tell you that now than have you join and feel misled.
What’s already inside the community:
April 2026 — Textile sector deep-dive — a market leader quietly riding the China+1 shift the street kept underestimating.
May 2026 — Pharma sector deep-dive — including a CDMO almost nobody is covering yet, with high entry barriers and a structural demand tailwind.
Last month — two healthcare compounders — one diagnostics leader, one niche pharma play, both studied when sentiment was ugly and the thesis was intact.
This month — Ratnamani Metals & Tubes — the established, higher-margin player in this exact sector. The Venus article covered the comparison at surface level. The report goes into the valuation math, the concall signals, the cycle positioning, and whether the risk-reward on Ratnamani today is actually more interesting than Venus at current prices. Two companies, one sector, very different setups.
Also this month — two more setups: a precision consumables leader staring down a demand recovery the market has written off, and a premium kitchen-and-quartz play with a moat most investors don’t even realise exists. Names inside.
Small Cap Research club embodies the same framework you just watched in action. Same honesty about what’s expensive and what isn’t. Same refusal to oversell a setup. 10x deeper, on multiple businesses, every single month.
We’re have crossed 2,000 Substack members. A big thank you for that. To mark this event, I’m opening a discount. Use code ROHIT20 for 20% off on the annual membership (valid for the next 2 days).
Thank you, genuinely, for giving this piece your time and attention. If it helped you see this business more clearly, the best compliment you can pay me is to hit like and share it with one person who invests the way you want to. Also Restack it show support.It tells me to keep making these.
Disclaimer: This article is for educational and informational purposes only. Nothing here constitutes investment advice or a recommendation to buy, sell, or hold any security. Stock markets involve risk, including the risk of losing capital. Always do your own research and consult a SEBI-registered investment advisor before making any investment decisions. The author may or may not hold positions in the securities discussed.
Super analysis brother